Spot Diagram
A spot diagram uses a very large number of skew ray-trace analyses to build a comprehensive view of how an image forms on the image sensor, be it the human eye, photographic film, or a CCD imager.
Entrance Pupil
The optical definition of the entrance pupil is the aperture stop when viewed from the front of the optical system. The aperture stop may be a purpose-built stop to limit the entrance of light, such as the diaphragm aperture on a SLR camera lens or the internal stop of a flat-field Schmidt-Cassegrain telescope. Alternatively the aperture stop might be unintentional, or at least less obvious, such as an undersized secondary mirror, Cassegrain baffle tube, focuser draw tube, filter glass holder, or other obstruction anywhere in the optical system. However and wherever the effective aperture stop is located, the stop is viewed from the front of the optical system where any intervening optical elements may magnify or minify the entrance pupil's apparent size of the actual stop.
Good telescope designs make an effort to ensure that all components of the telescope are well-matched in size so that no single component is a more significant aperture stop than any other. For this reason and with few exceptions, the entrance pupil is often closely approximated by the actual aperture of the telescope's objective.
The first step in constructing a spot diagram is to fill the entrance pupil with evenly spaced points which will be considered as the points where representative light rays will enter the pupil.
For a refractor with no unintentional internal stops - no undersized focus tube or filter - the evenly spaced incident points might be as below.
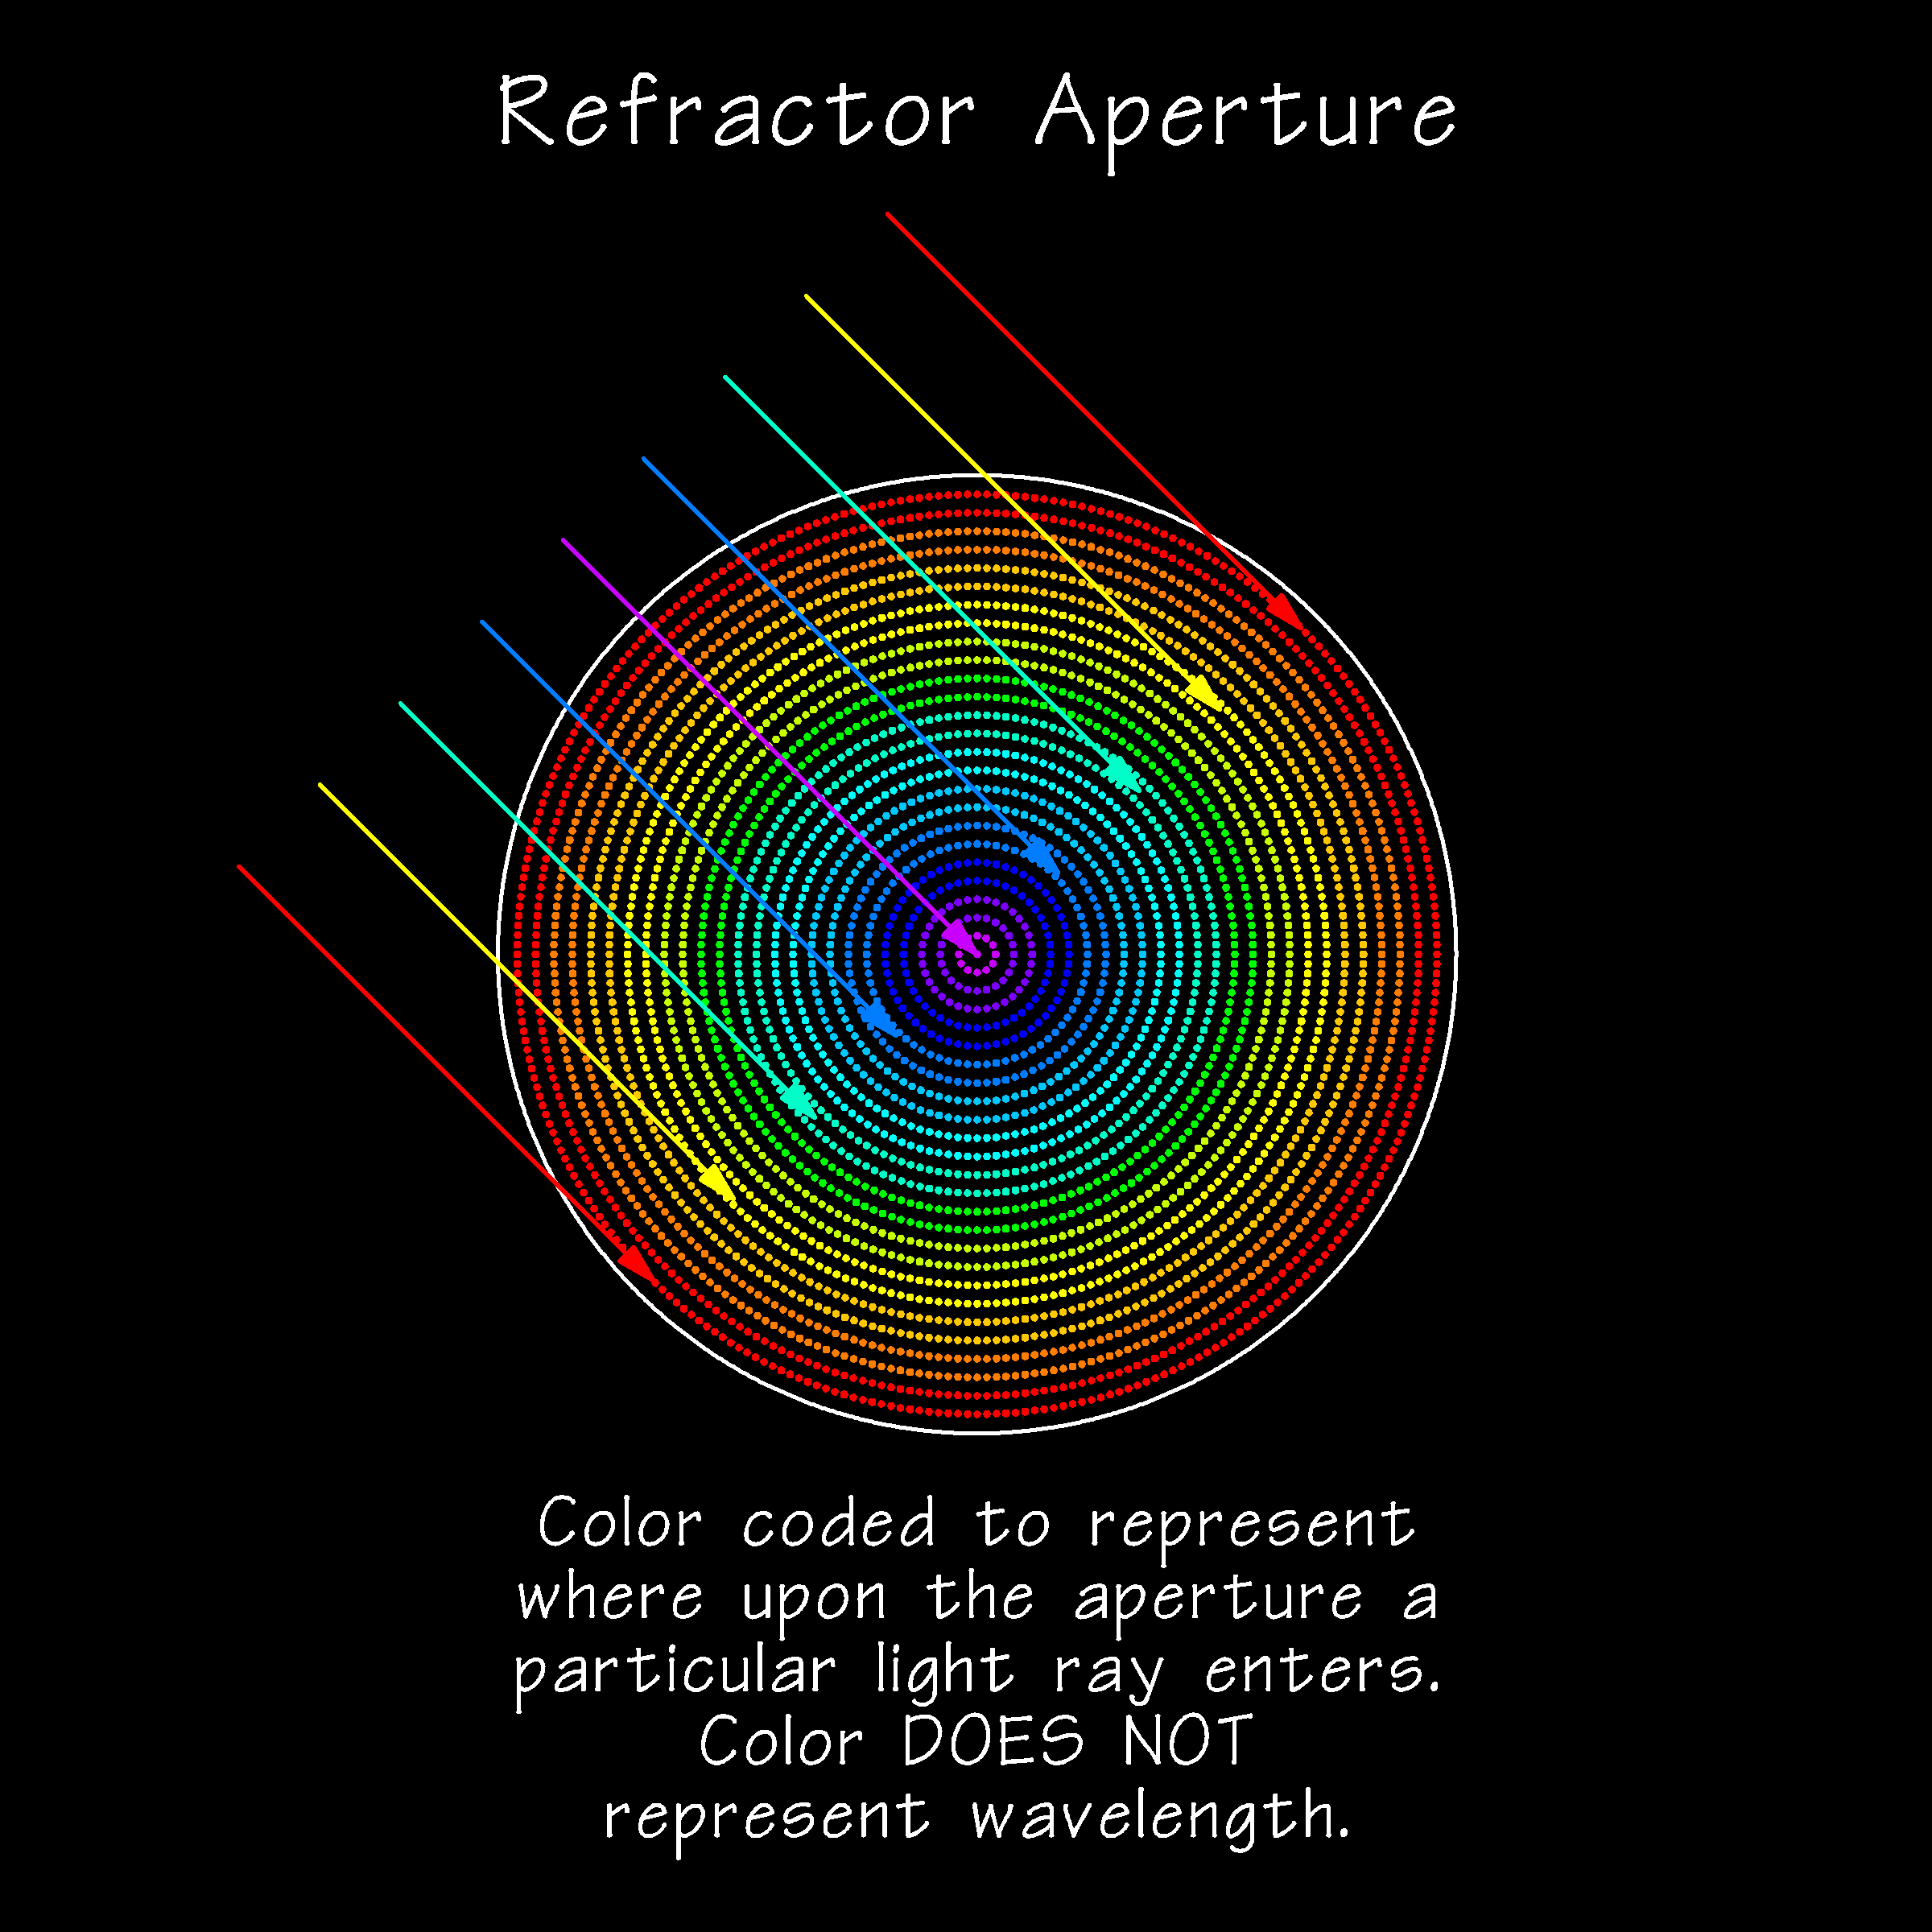
|
For a reflector or catadioptric with a central obstruction due to the secondary mirror, the evenly spaced incident points might be as below.
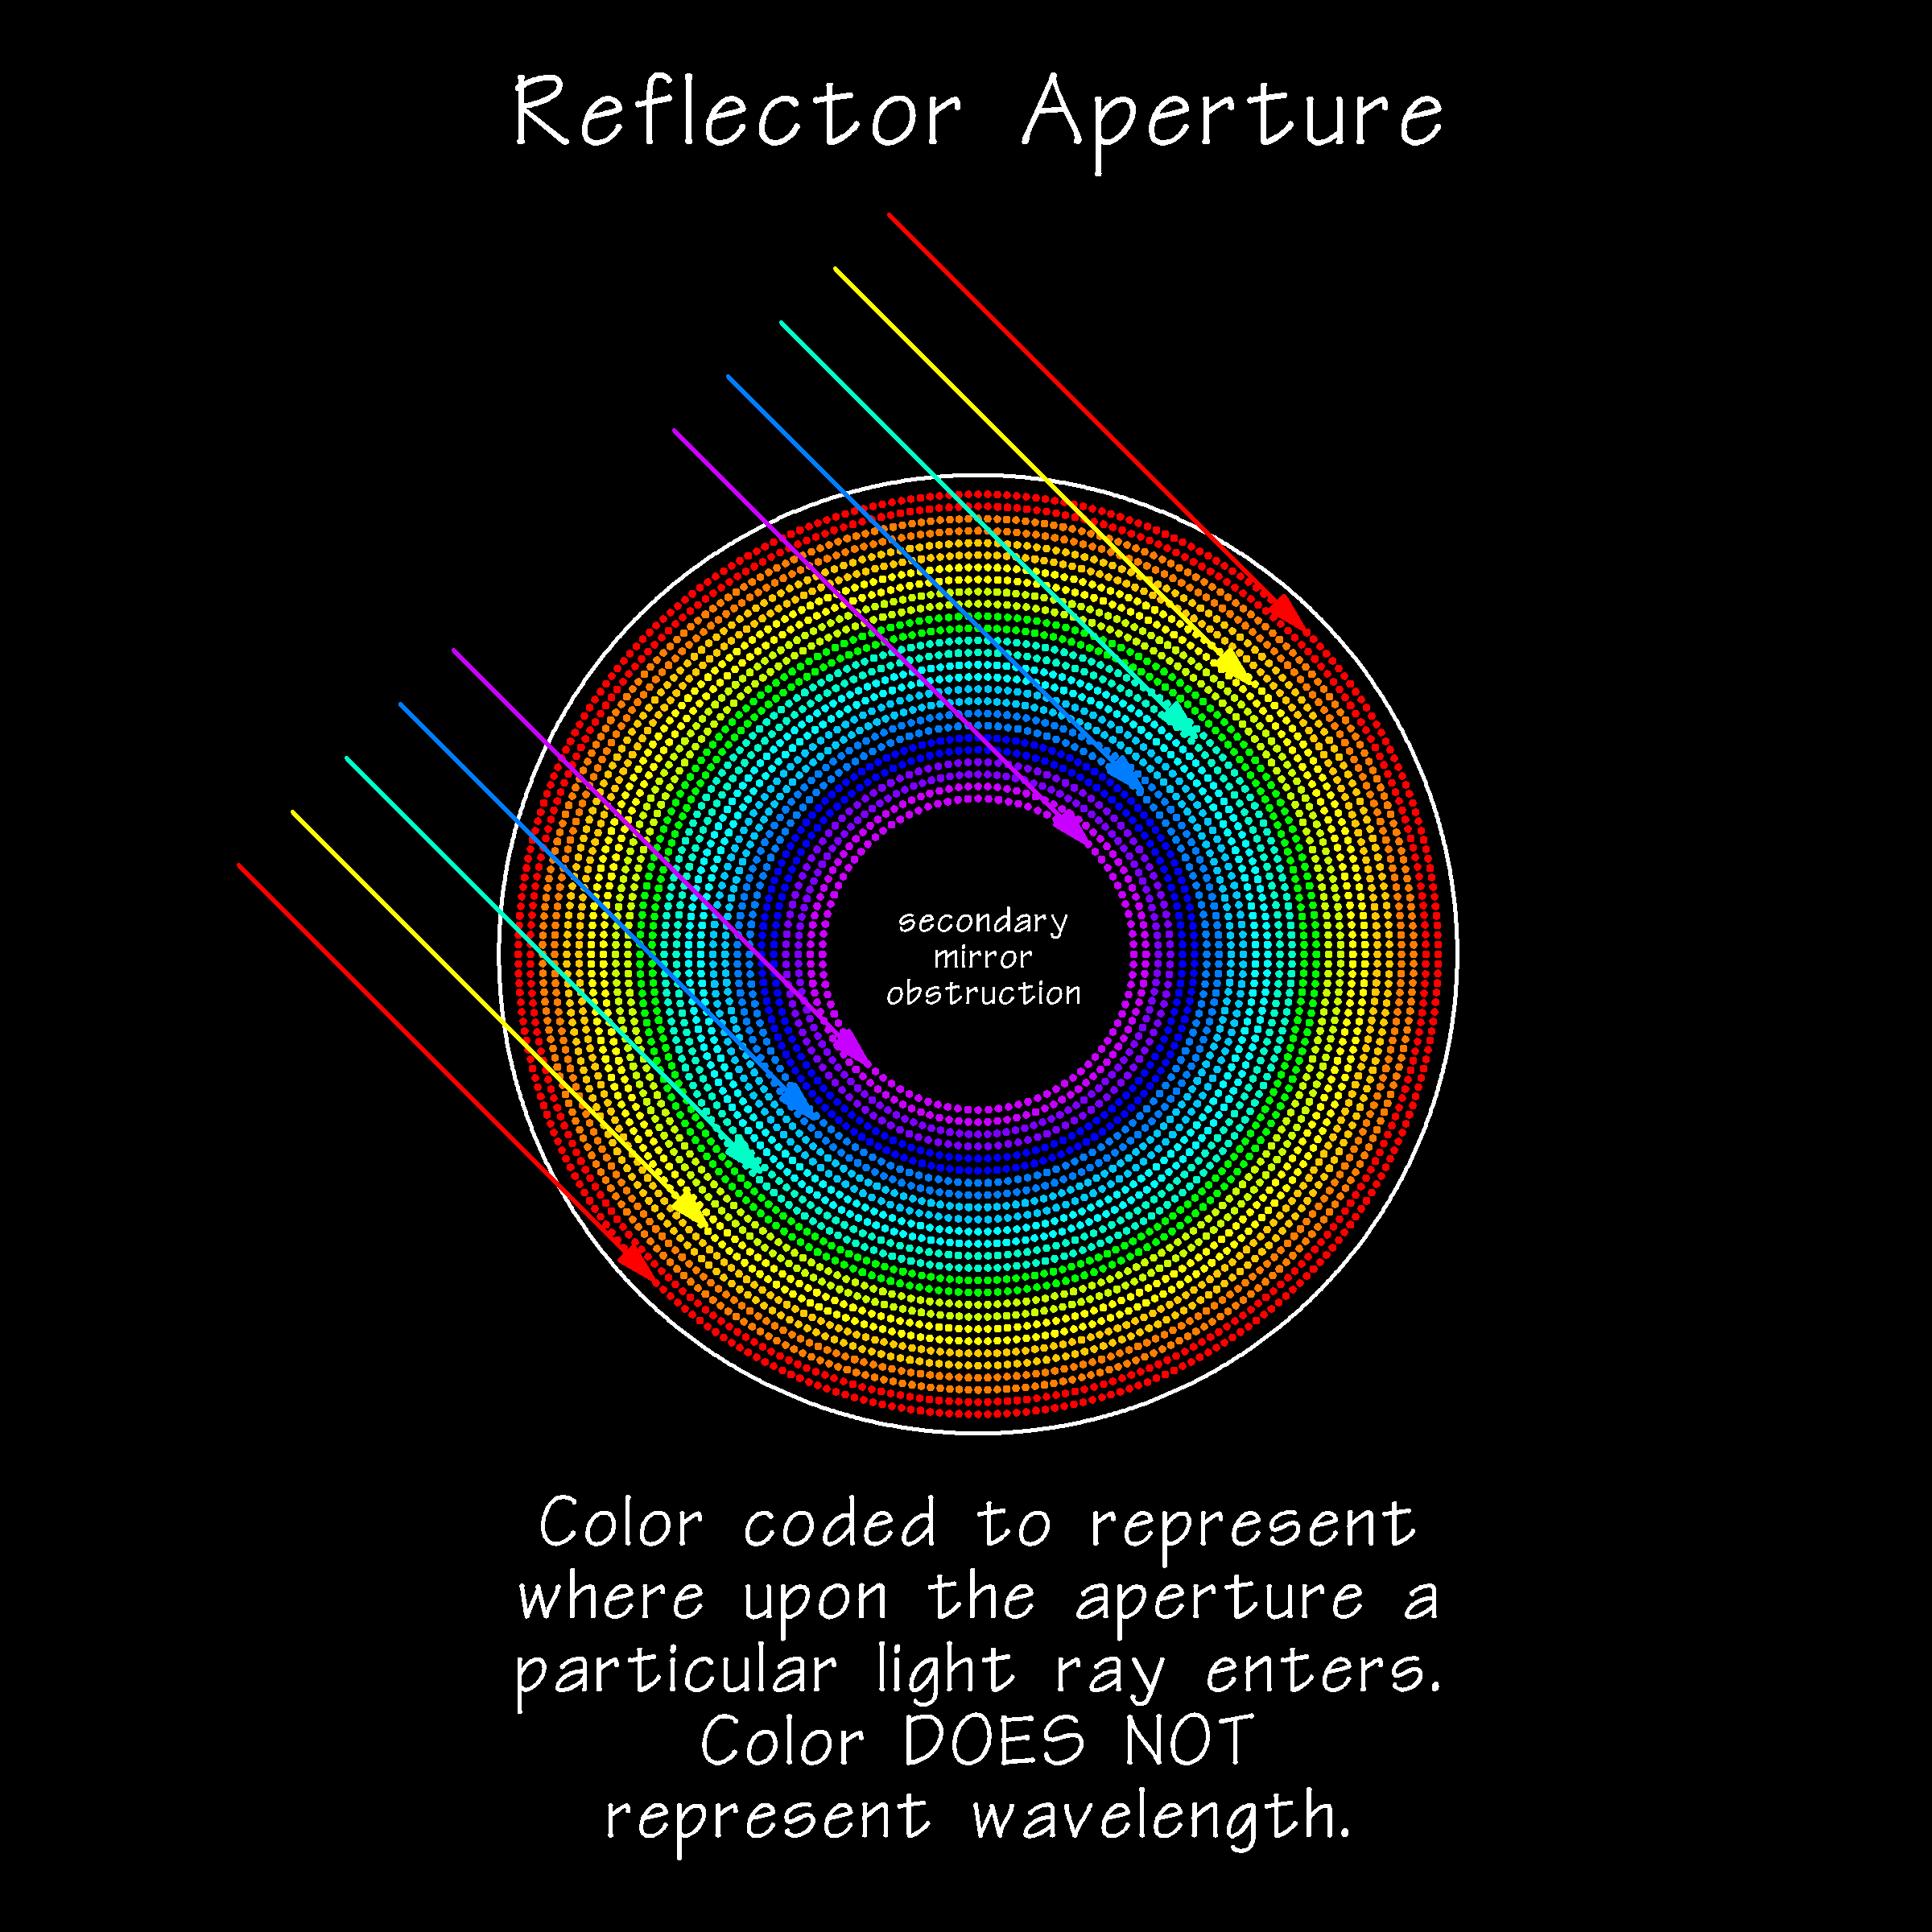
|
For the spot diagrams presented here the incident points are color coded so that it is possible to know where upon the aperture a particular light ray originated. The convention adopted here is that red is to the outside edge of apertuer and violet is to the middle of the aperture, with color gradations between. It must be emphasized that these color codes represent location and not wavelenghts.
Skew Ray-Trace
The next step of constructing a spot diagram is to use the off-axis angle of incidence desired for the analysis together with each individual incident point to define an incident light ray. Skew ray-trace analysis is then appiled to each of these incident light rays until they reach the desired focal plane, typically the CCD imager surface. The location where each of these ray-traced light rays reaches the focal plane is then recorded in the same color coding used for the incident points on the aperture. The collection of all these points on the imager surface is the spot diagram.
For a doublet refractor, the color coded light rays passing through the two lenses might be as below.
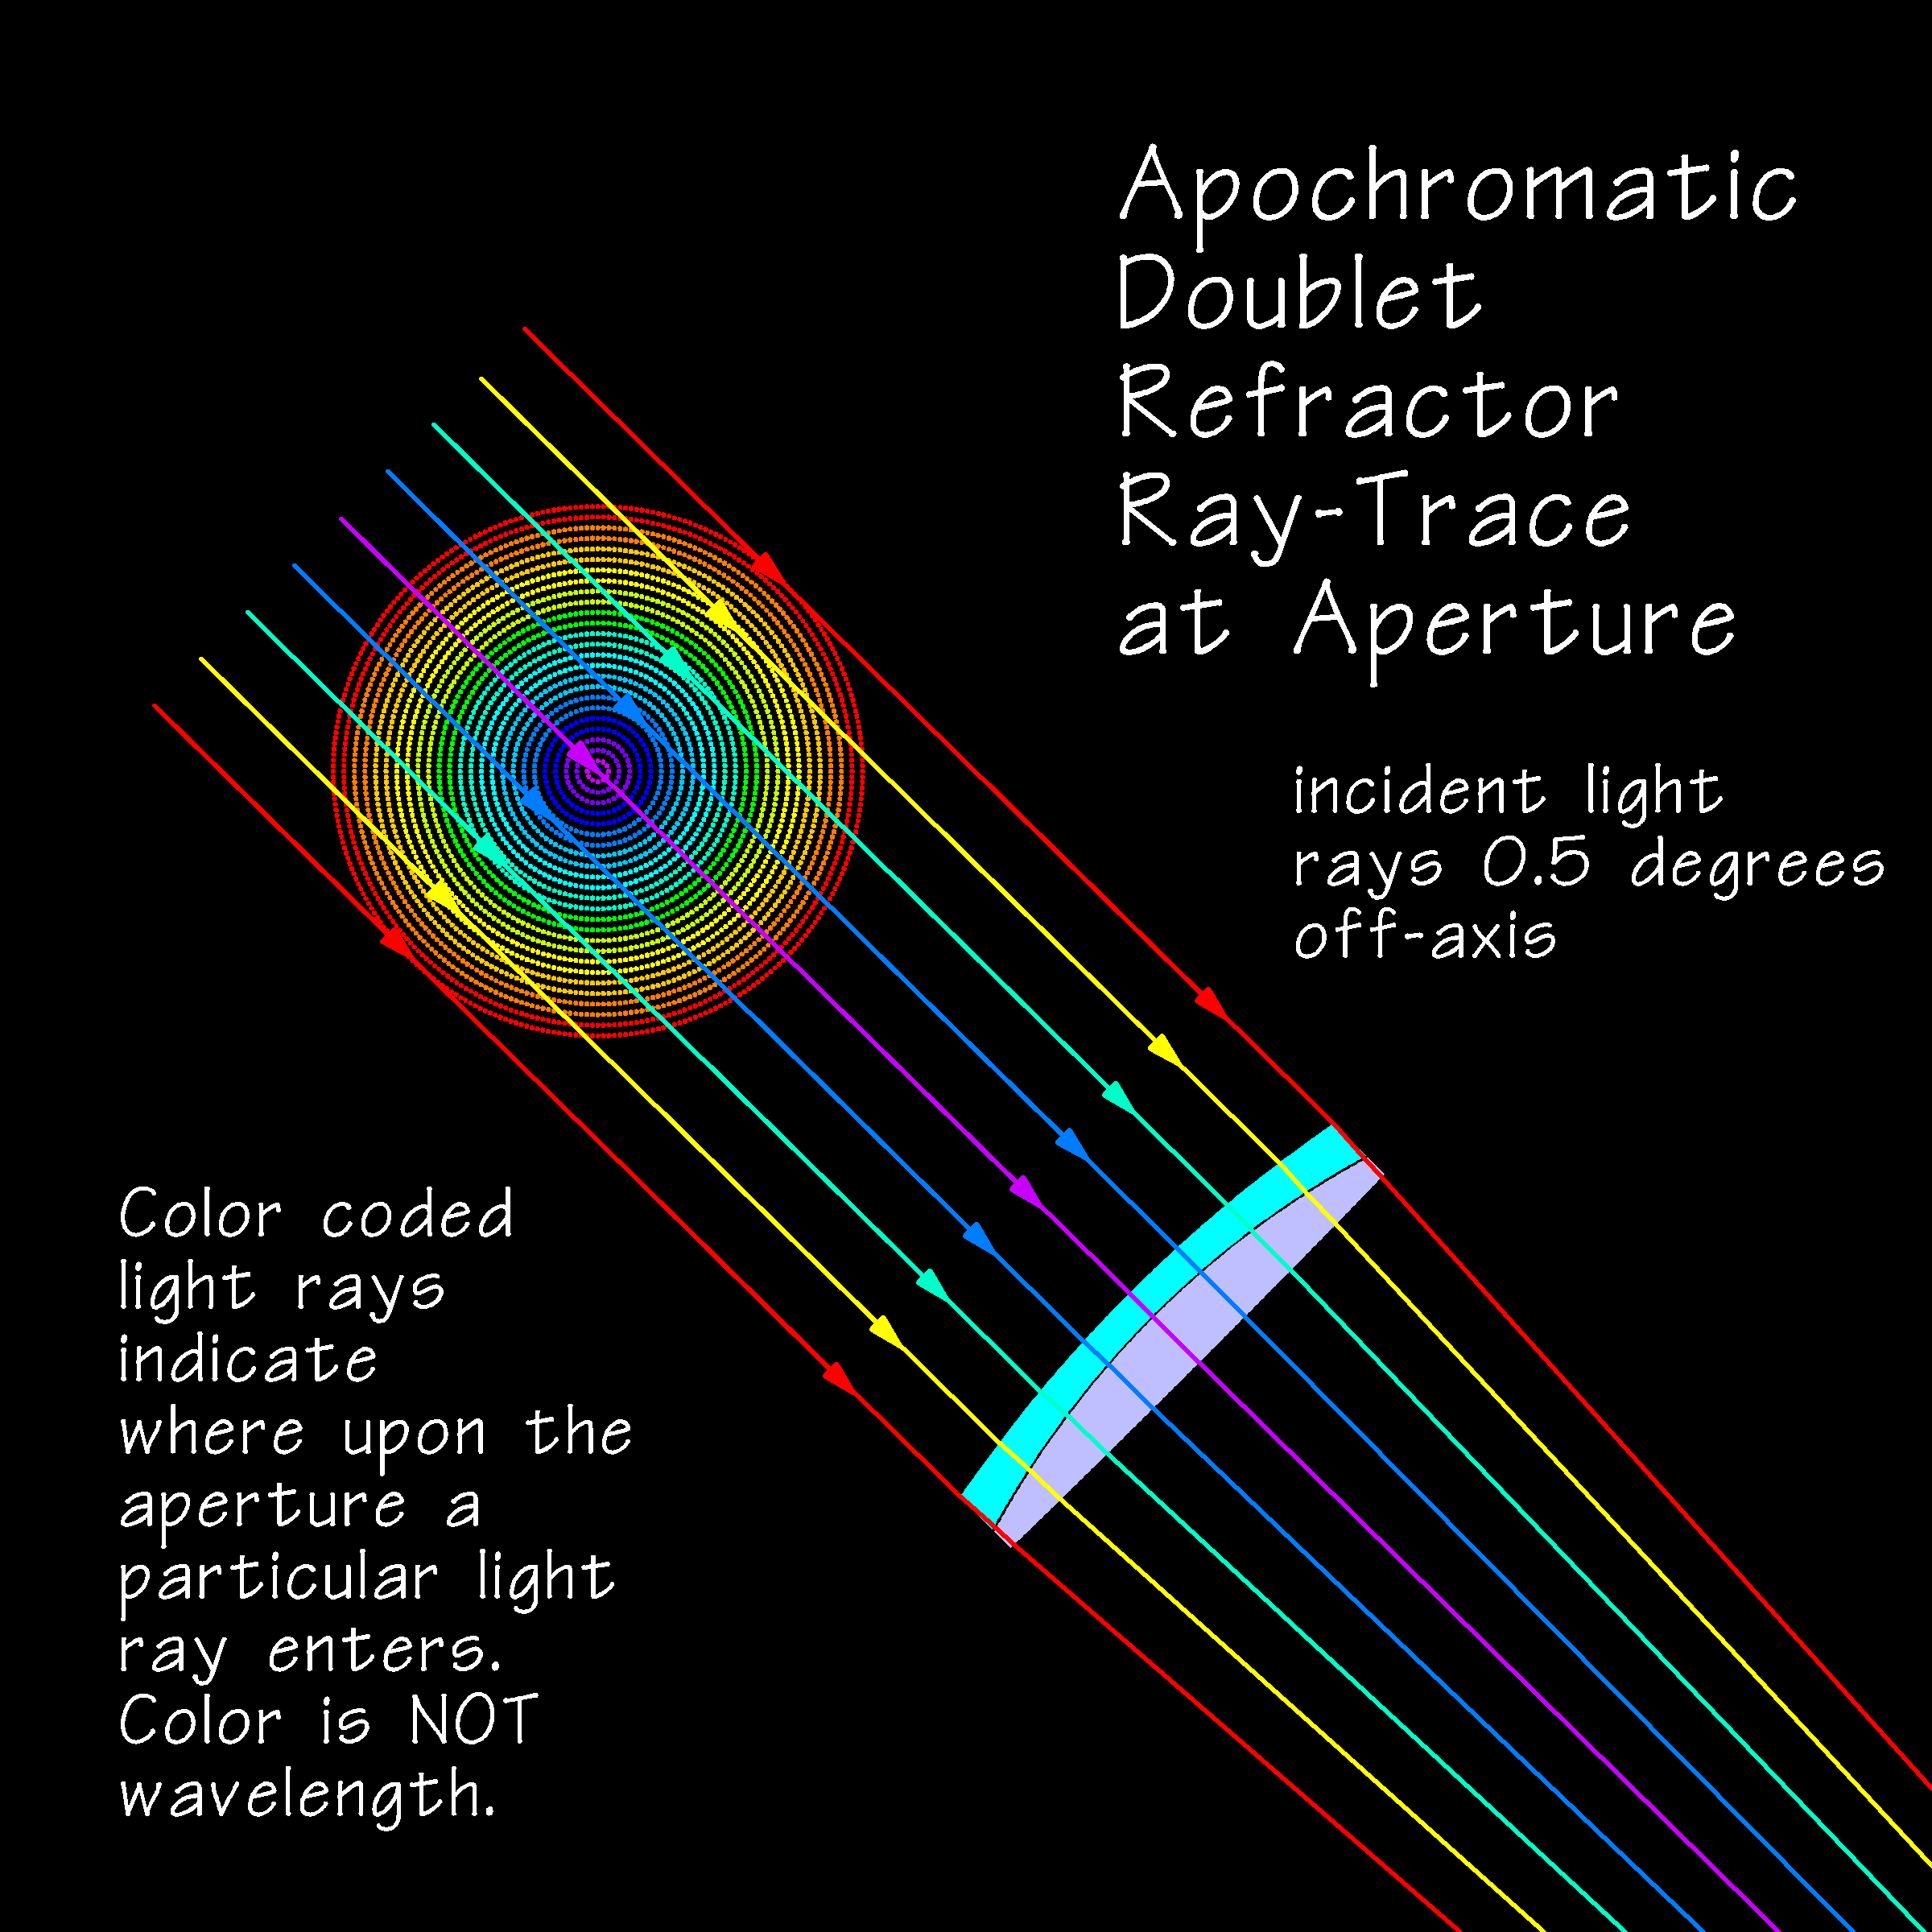
|
For the same doublet refractor, the color coded light rays arriving at the CCD imager surface might be as below.
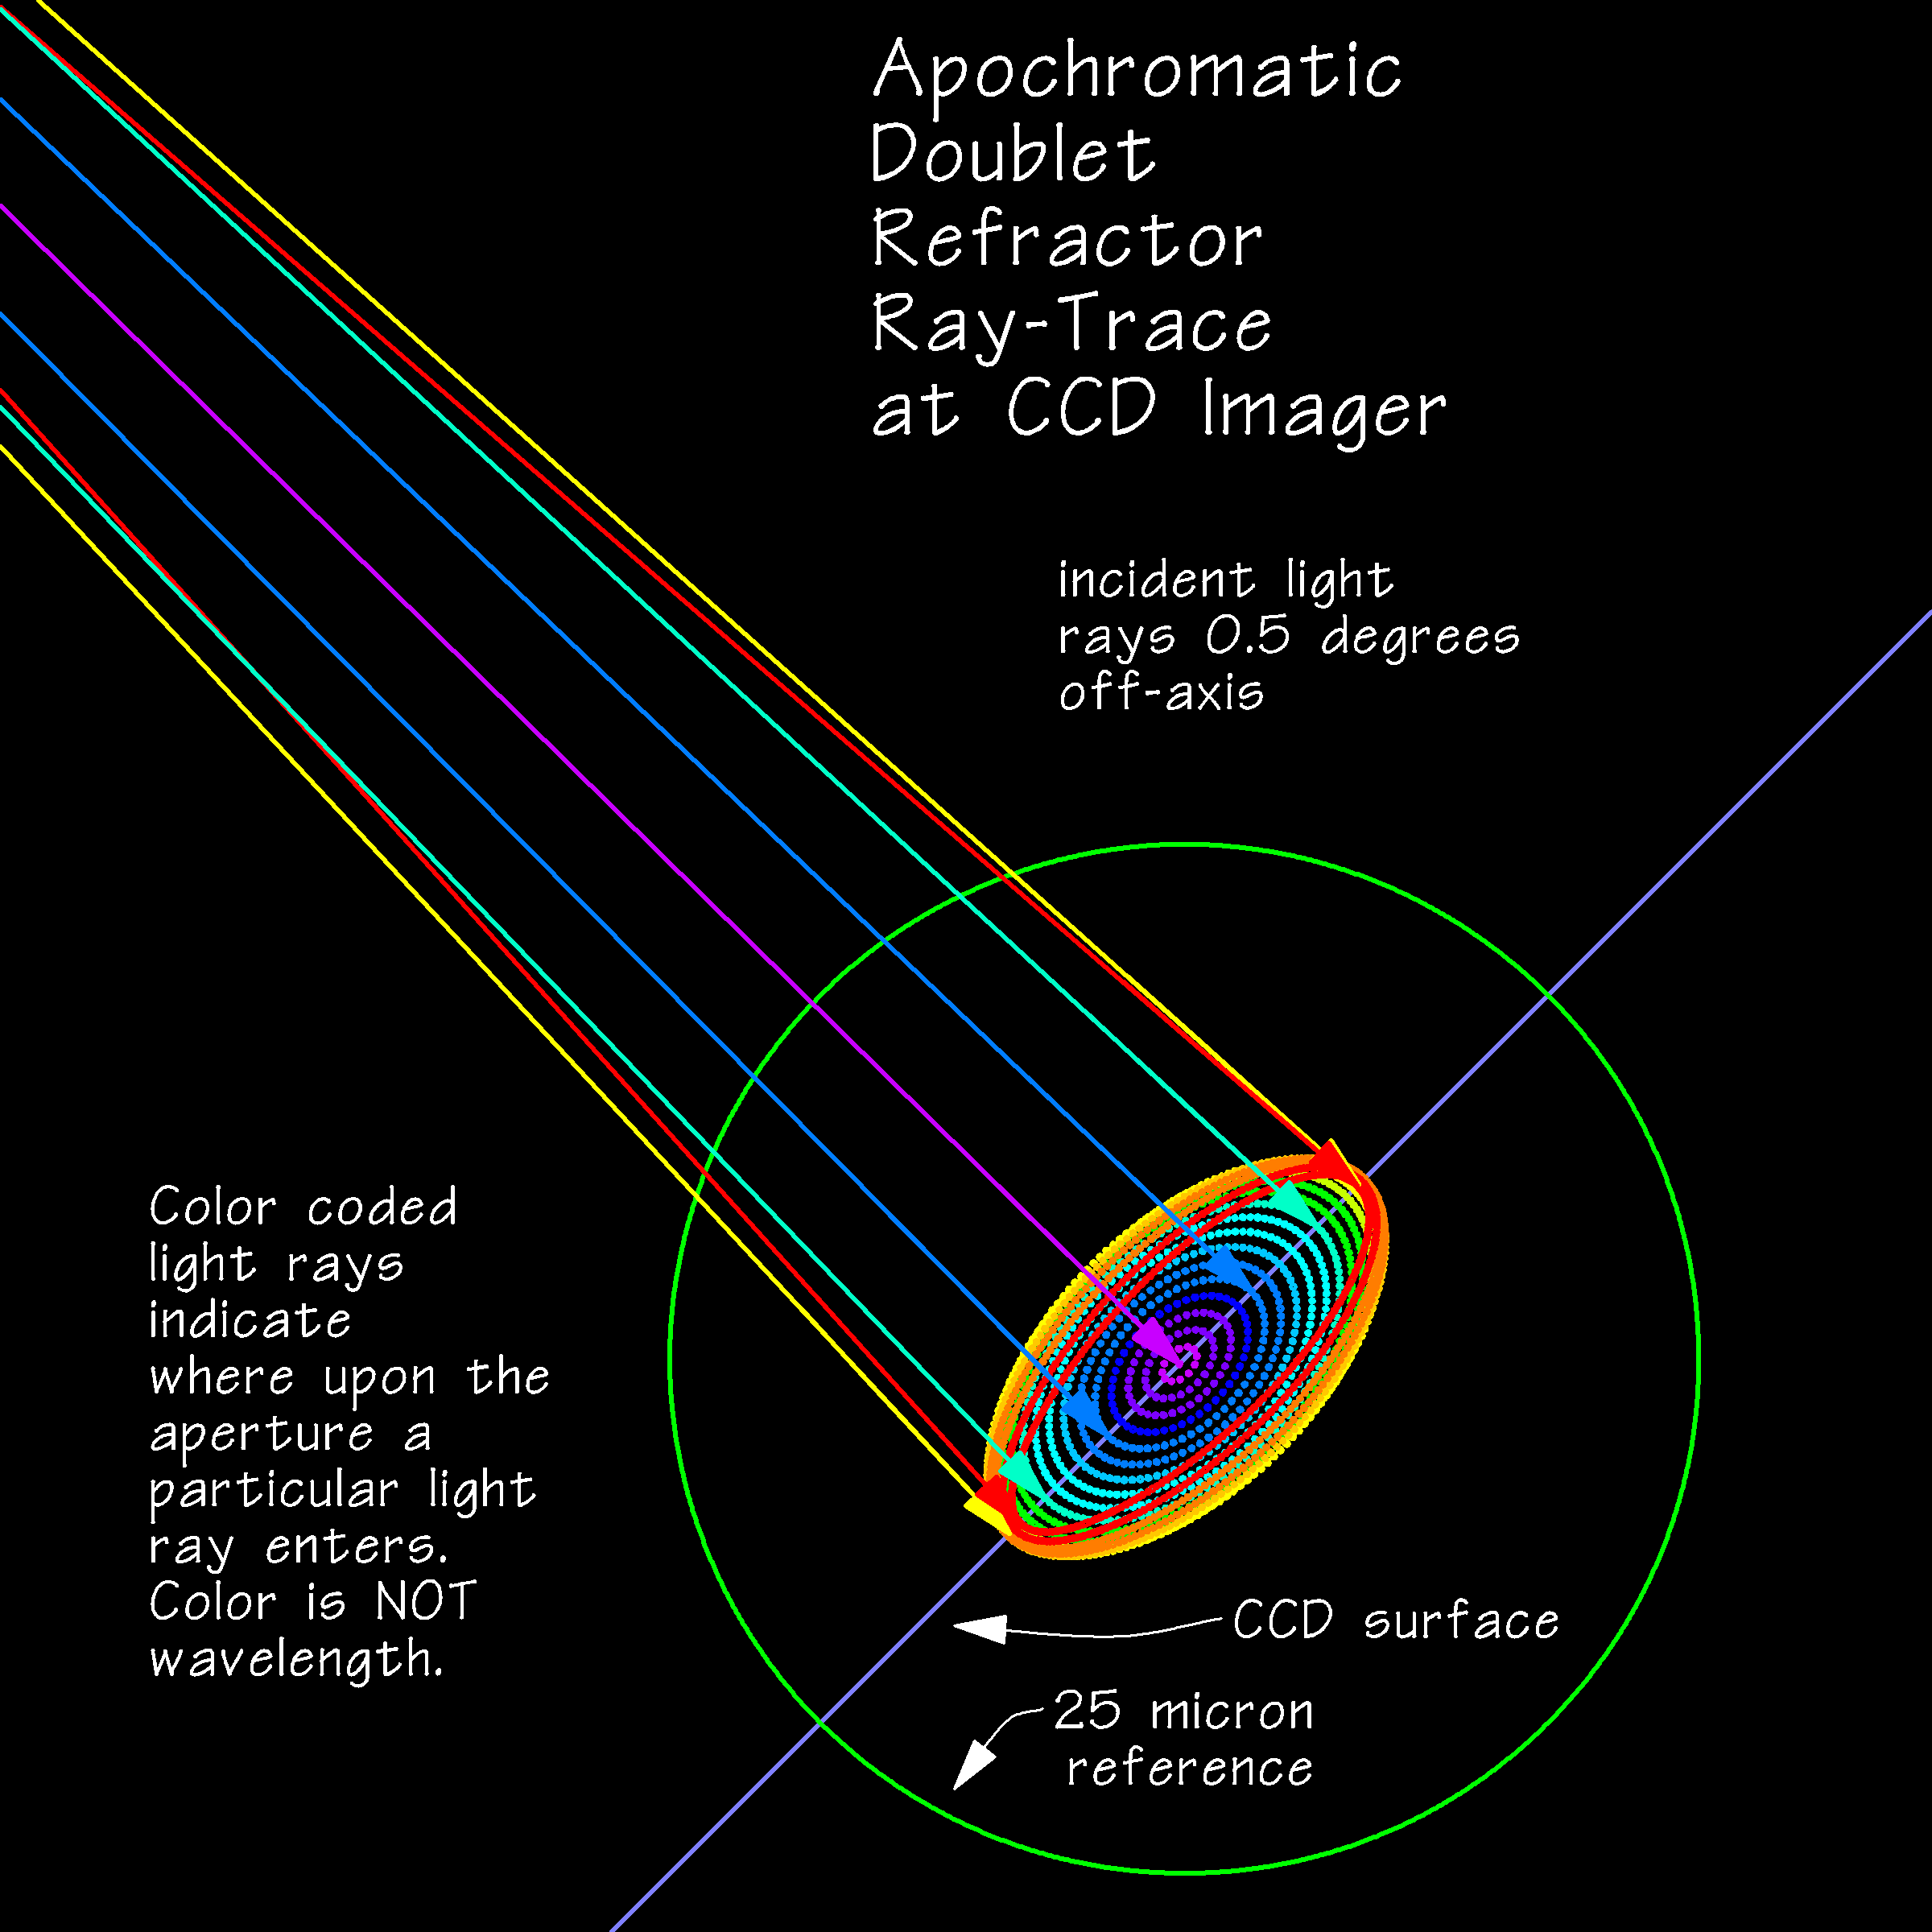
|
The above spot diagram analysis was done using 546 nanometer green light and 0.5 degrees off-axis with the imaging setup focused at the center of the field of view. Interpretation of the spot diagram:
- less than perfect focus caused by field curvature 0.5 degrees off-axis is indicated by general spreading of the spot diagram
- astigmatism is indicated by elongation of the spot diagram
- spherical aberration is indicated by uneven spreading with more light into the outer edges of the spot diagram
