Ray-Trace Analysis
Ray-trace analysis is a technique for studying the behavior of light rays as they pass from a source through an optical system and form an image. For example, light rays from a deep-space object passing through a telescope's optics and forming an image on a CCD imager.
Paraxial Approximation
Paraxial refers to light rays which are very nearly parallel to the axis of the optical system and pass very close to the optical axis. For example, light rays very near the center of the field of view and passing very near the center of the telescope aperture. Thus, paraxial approximations specifically exclude analysis of a wide field of view or light rays entering near the edge of an aperture.
Under the assumptions of the paraxial approximation, certain calculations concerning an optical system can be approximated by very simple formulae. These simplifications are able to yield relatively accurate calculations as long as the assumptions of paraxial apply. For example, when designing a telescope, paraxial approximations can quickly and relatively accurately give the curvature of lenses and mirrors, the thicknesses of lenses, the spacing of lenses and distances between mirrors, and focal length and f/ratios and quickly test the paraxial performance of different glasses in the designs.
Paraxial approximations are a very powerful tool for design and basic analysis. However, the exclusion of a wide field of view and light rays away from the center of the aperture limit their accuracy and usefulness in a more general detailed analysis.
Skew Ray-Trace
Skew ray-trace is the analysis of the path of light rays as they pass through an optical system. Ray-trace uses the laws of refraction and reflection and the mathematical representation of the curved optical surfaces (lenses and mirrors) to perform very accurate calculations anywhere along the path of a light ray, whether near the optical axis or not. The term 'skew', often omitted and simply called 'ray-trace', refers to light rays which are not parallel to the optical axis but are 'askew' or 'skewed'. Thus, skew ray-trace is a completely general analysis technique which handles wide fields of view and whole apertures.
Snell's Law, or the law of refraction, accommodates the effects of various wavelengths of light. The refractive index of lenses depends upon the wavelength of the light, so skew ray-trace analysis must be done for a given wavelength. Chromatics aberrations are analyzed by doing skew ray-trace analyses for each of several different wavelengths, for example, near infrared, red, green, blue, and violet.
|
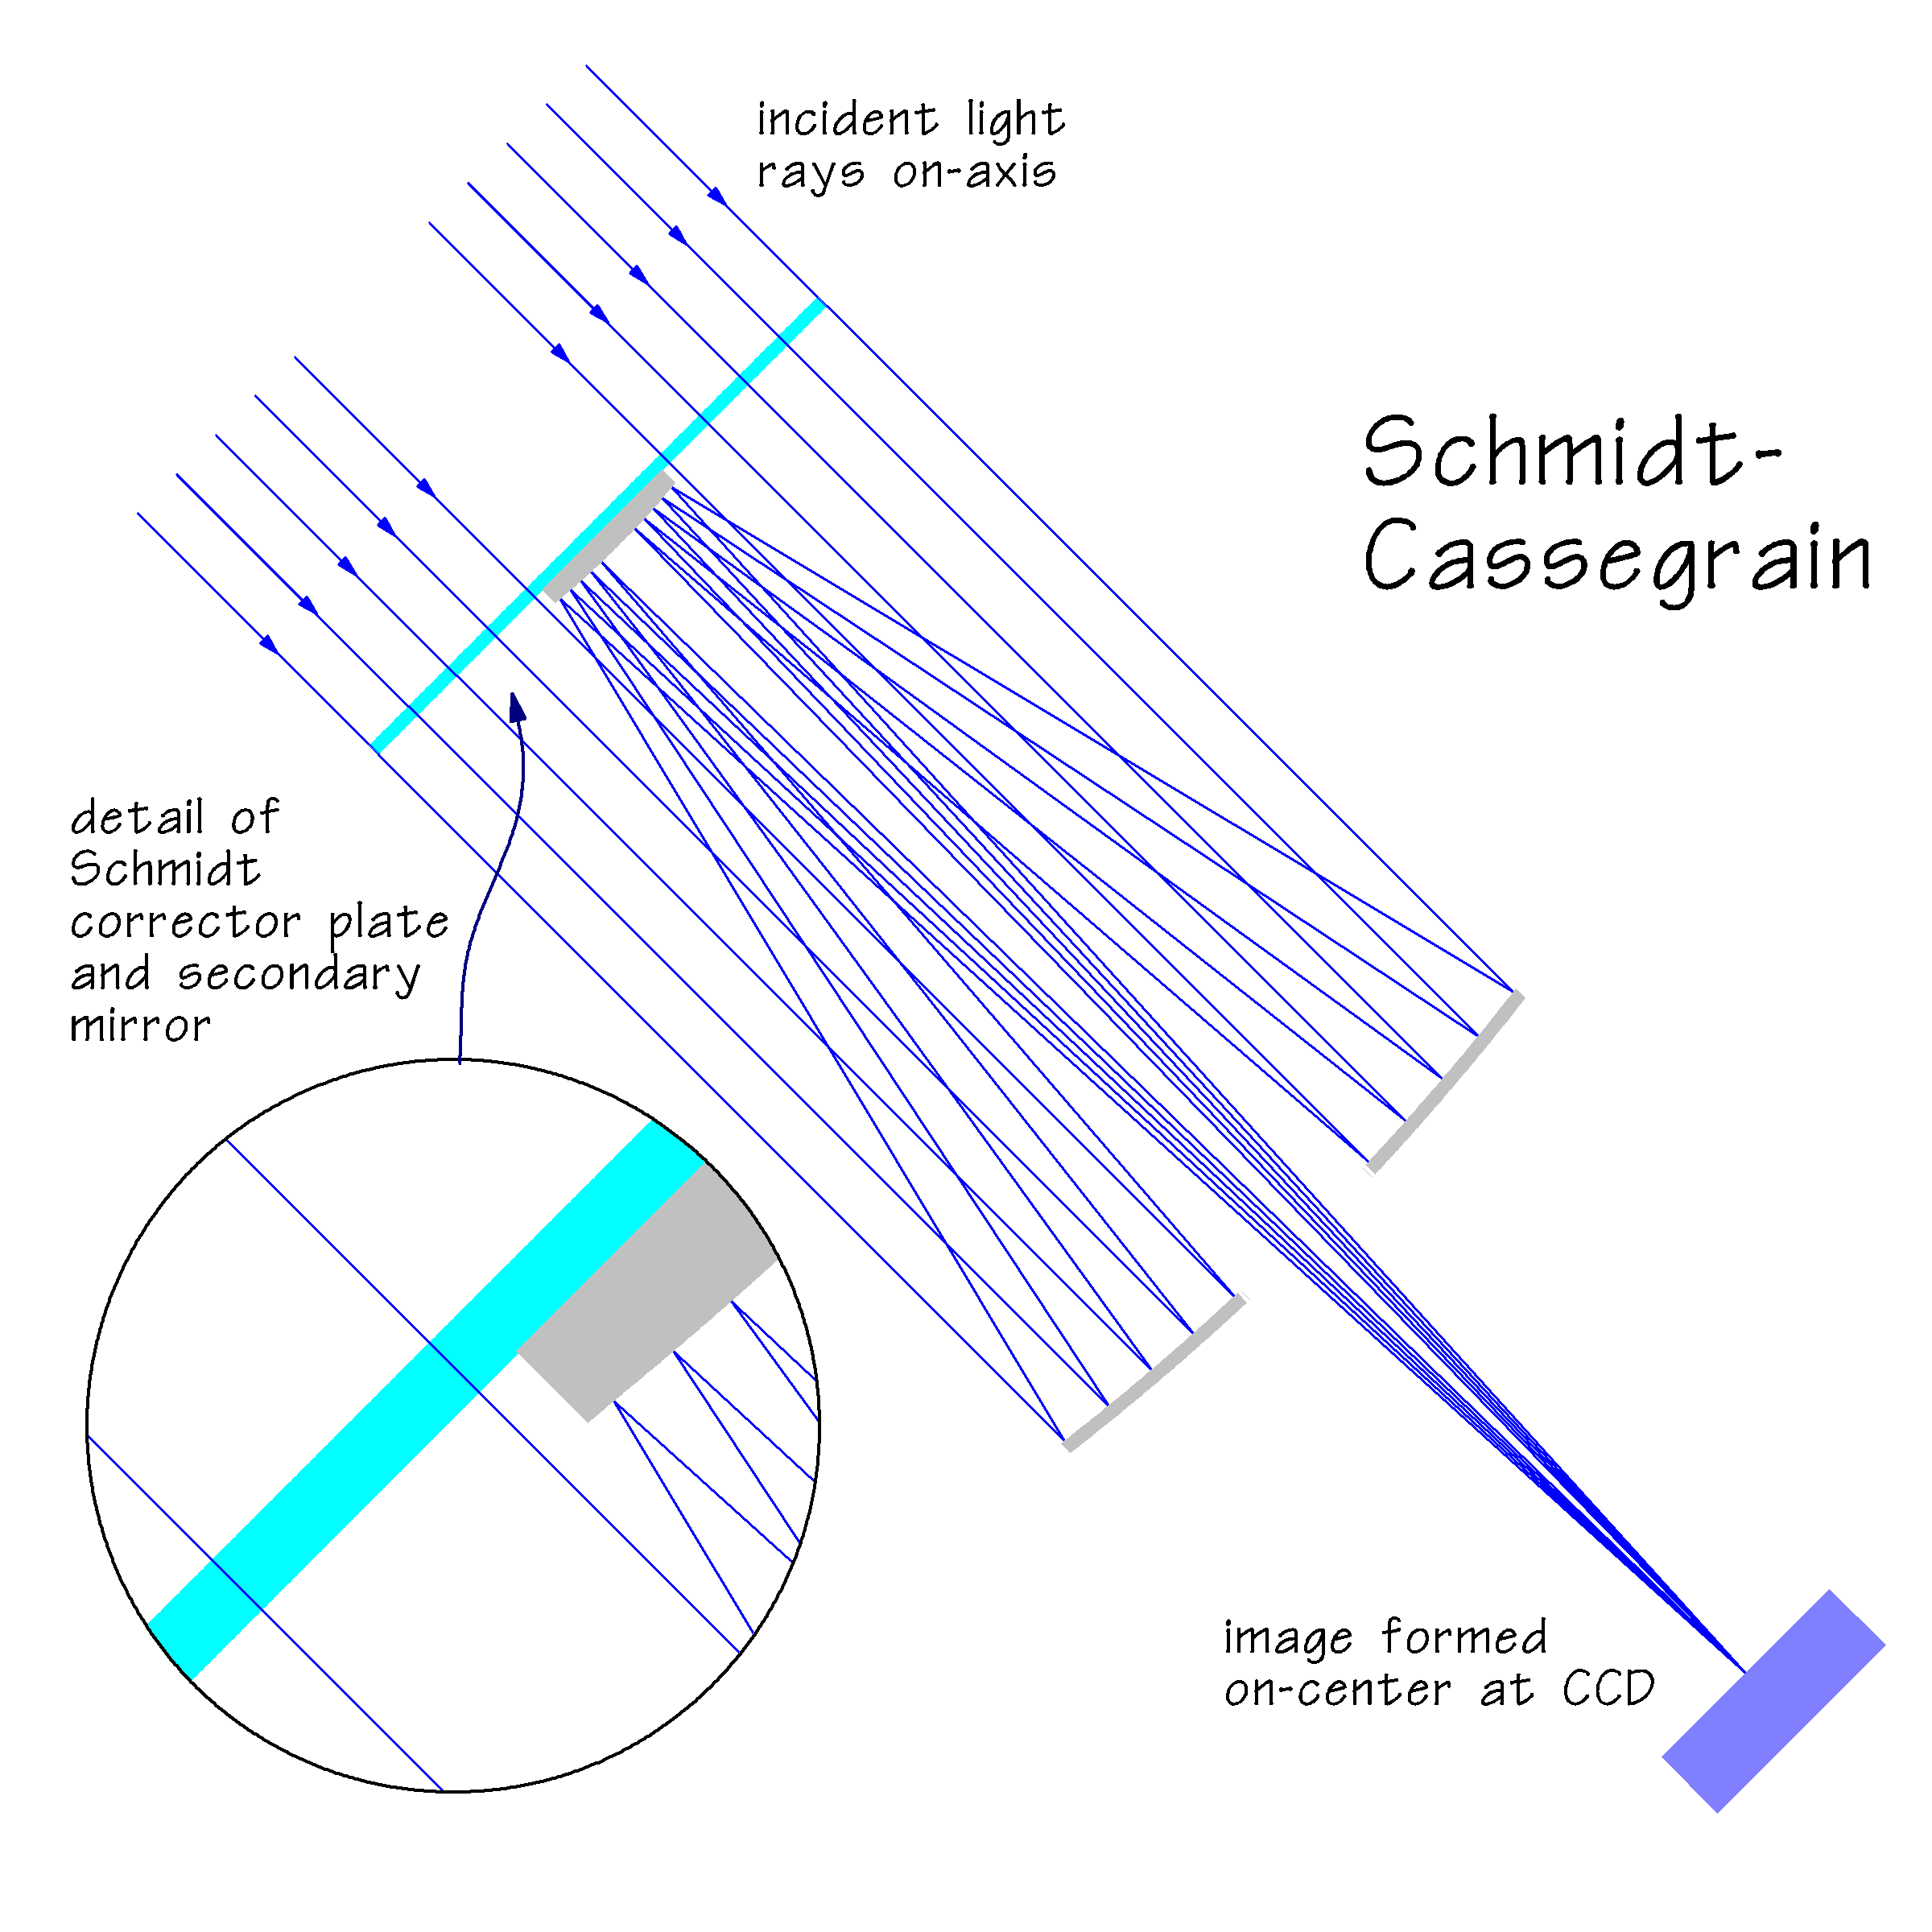
The above image shows how a skew ray-trace analysis can be done on a typical Schmidt-Cassegrain telescope. In the example, the arriving light rays are parallel to the optical axis, meaning they represent light rays emanating from a distant object at the center of the telescope field of view, called 'on-axis'. At every point where a light ray hits an optical surface, the skew ray-trace analysis applies the law of refraction for lenses and the law of reflection for mirrors to accurately determine the new direction of the light ray. Each light ray is sequentially traced from one optical surface to the next until the refracted and reflected light rays converge to focus at the surface of the CCD imager.
Because the refractive index of lenses depends upon the wavelength of the light, skew ray-trace analysis of any optical system involving lenses must be done for a given wavelength. The above example is for green light of wavelength 546 nanometers (a mercury emission line) which is one of the standardized wavelengths used by glass manufacturers for measuring and publishing refractive indexes.
|
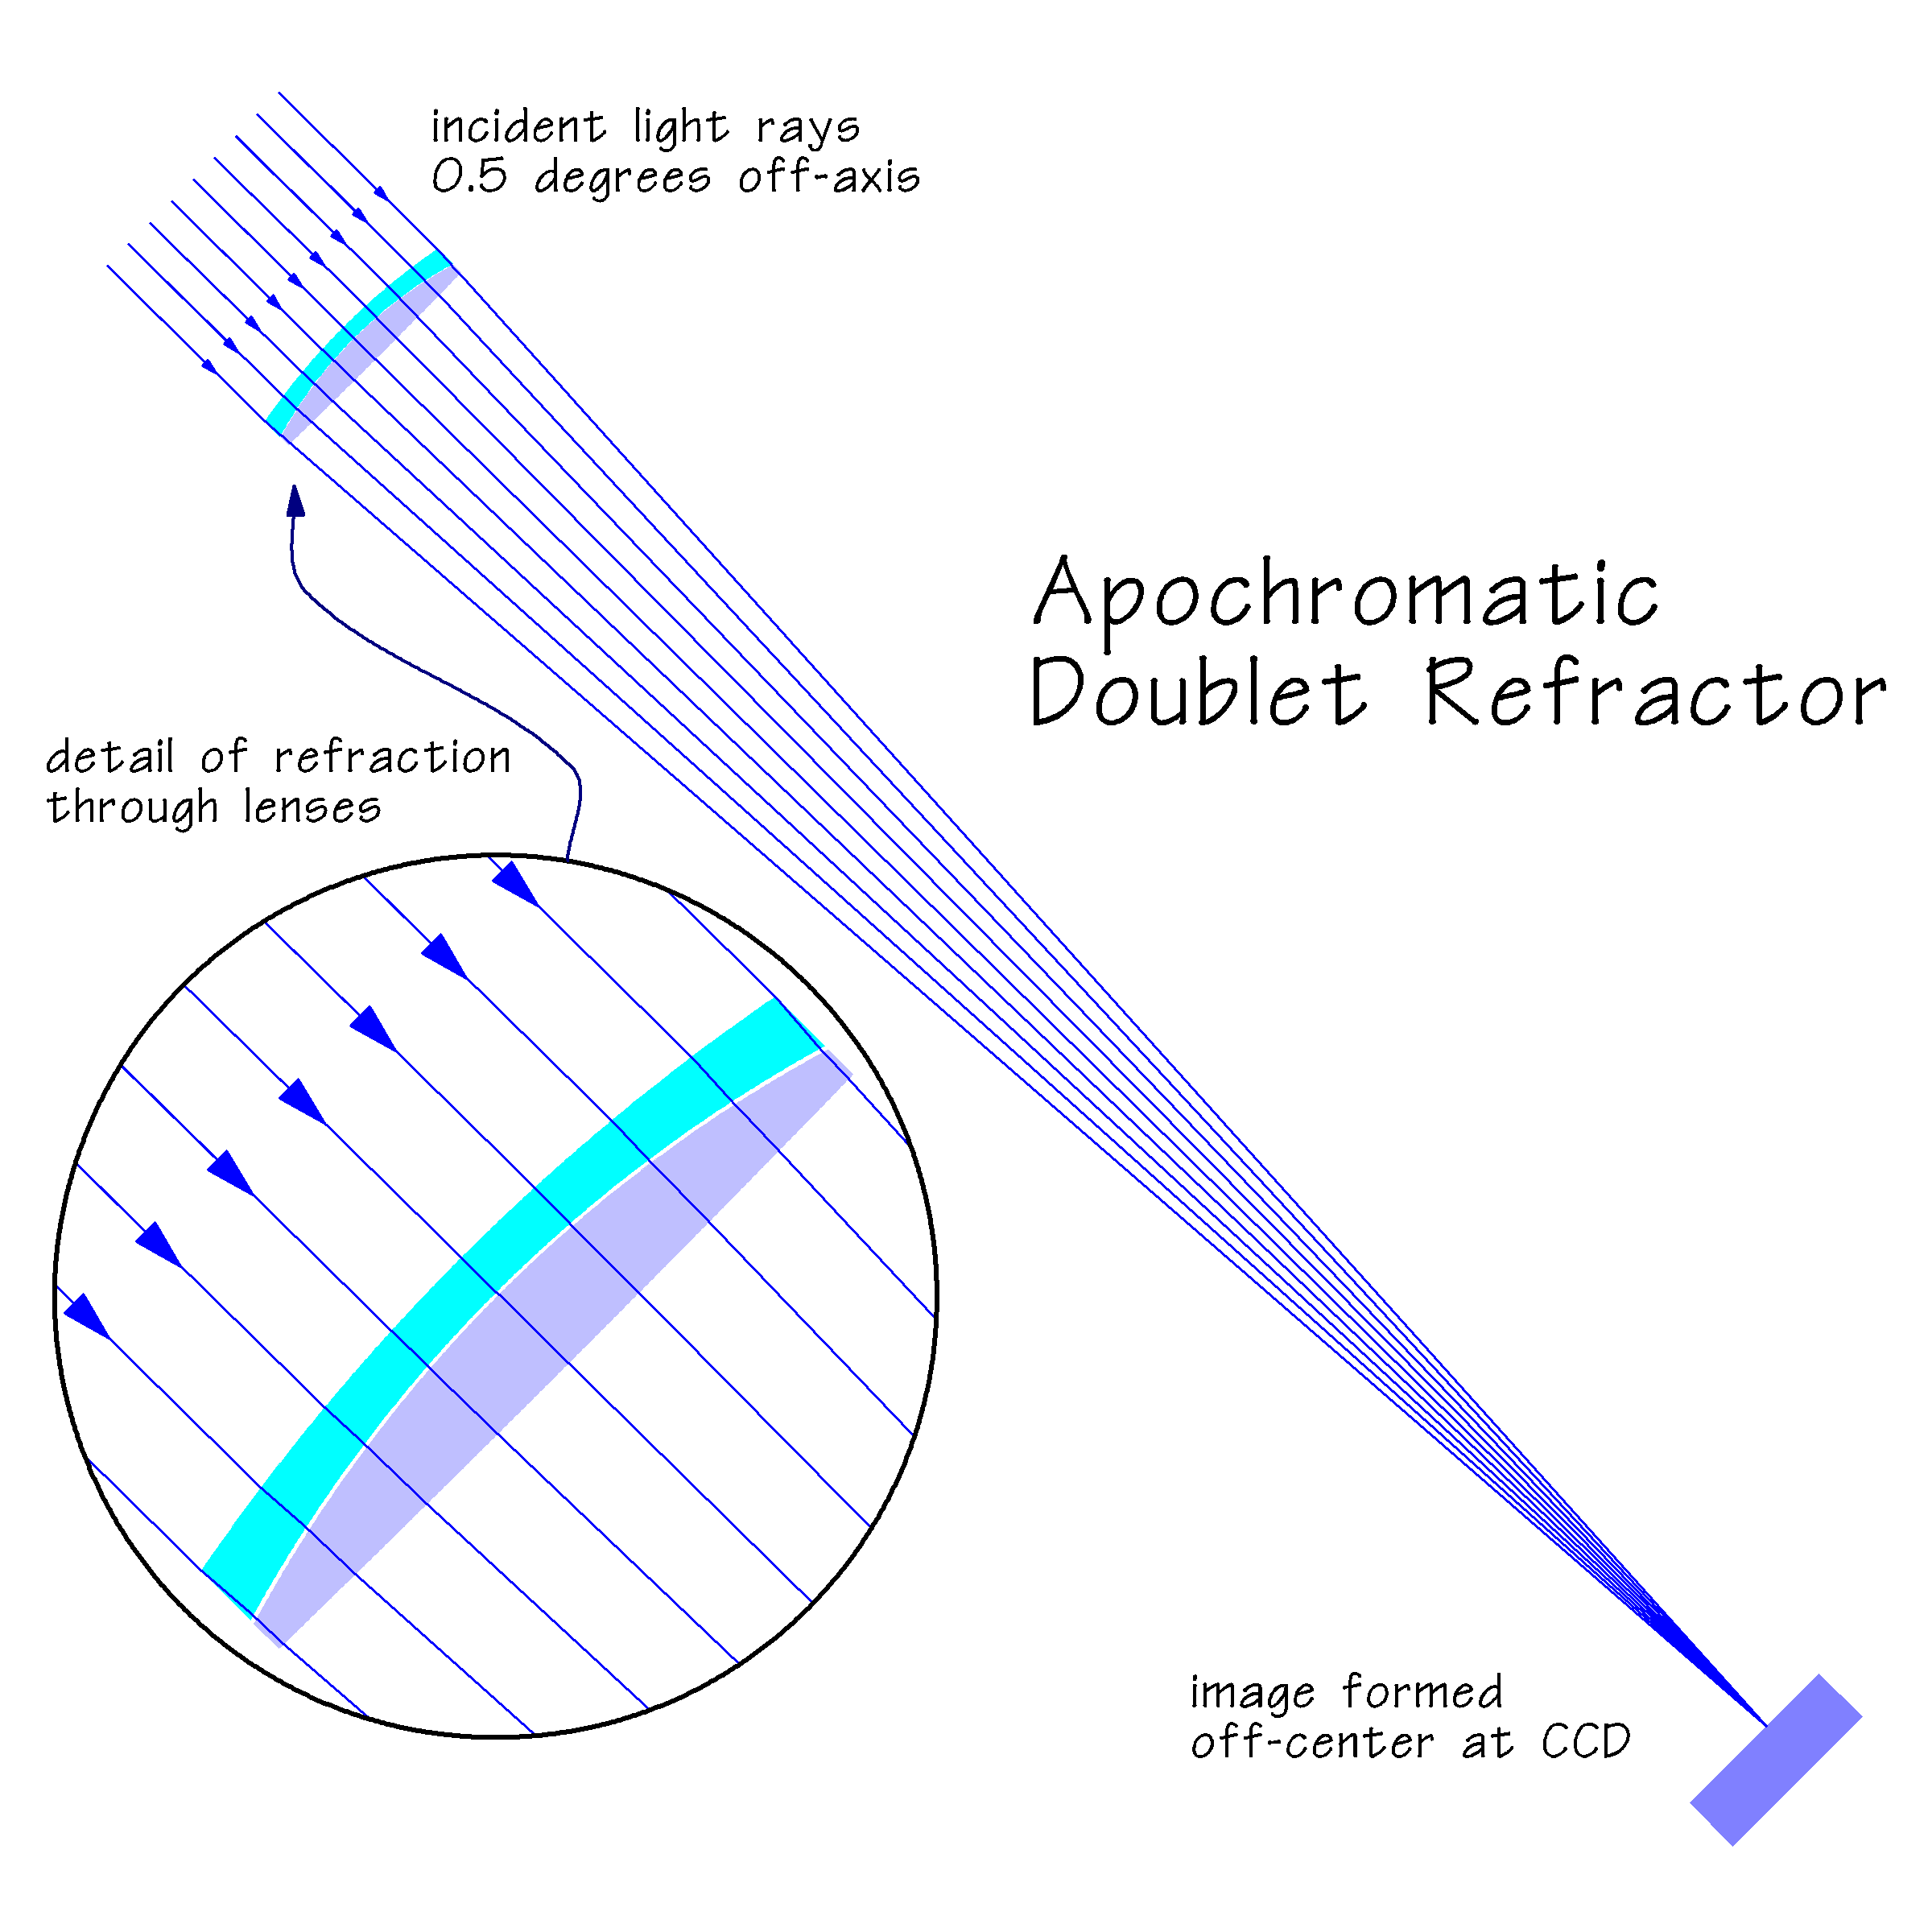
The above example is a skew ray-trace analysis of a doublet Fluorite apochromatic refractor. In this example the arriving light rays are 0.5 degrees away from the optical axis, meaning it represents a wide field of view. These off-axis light rays come to focus off-center on the CDD imager closer to the edge of the CCD chip. The analysis is again for the standard green wavelength of 546 nanometers.
|
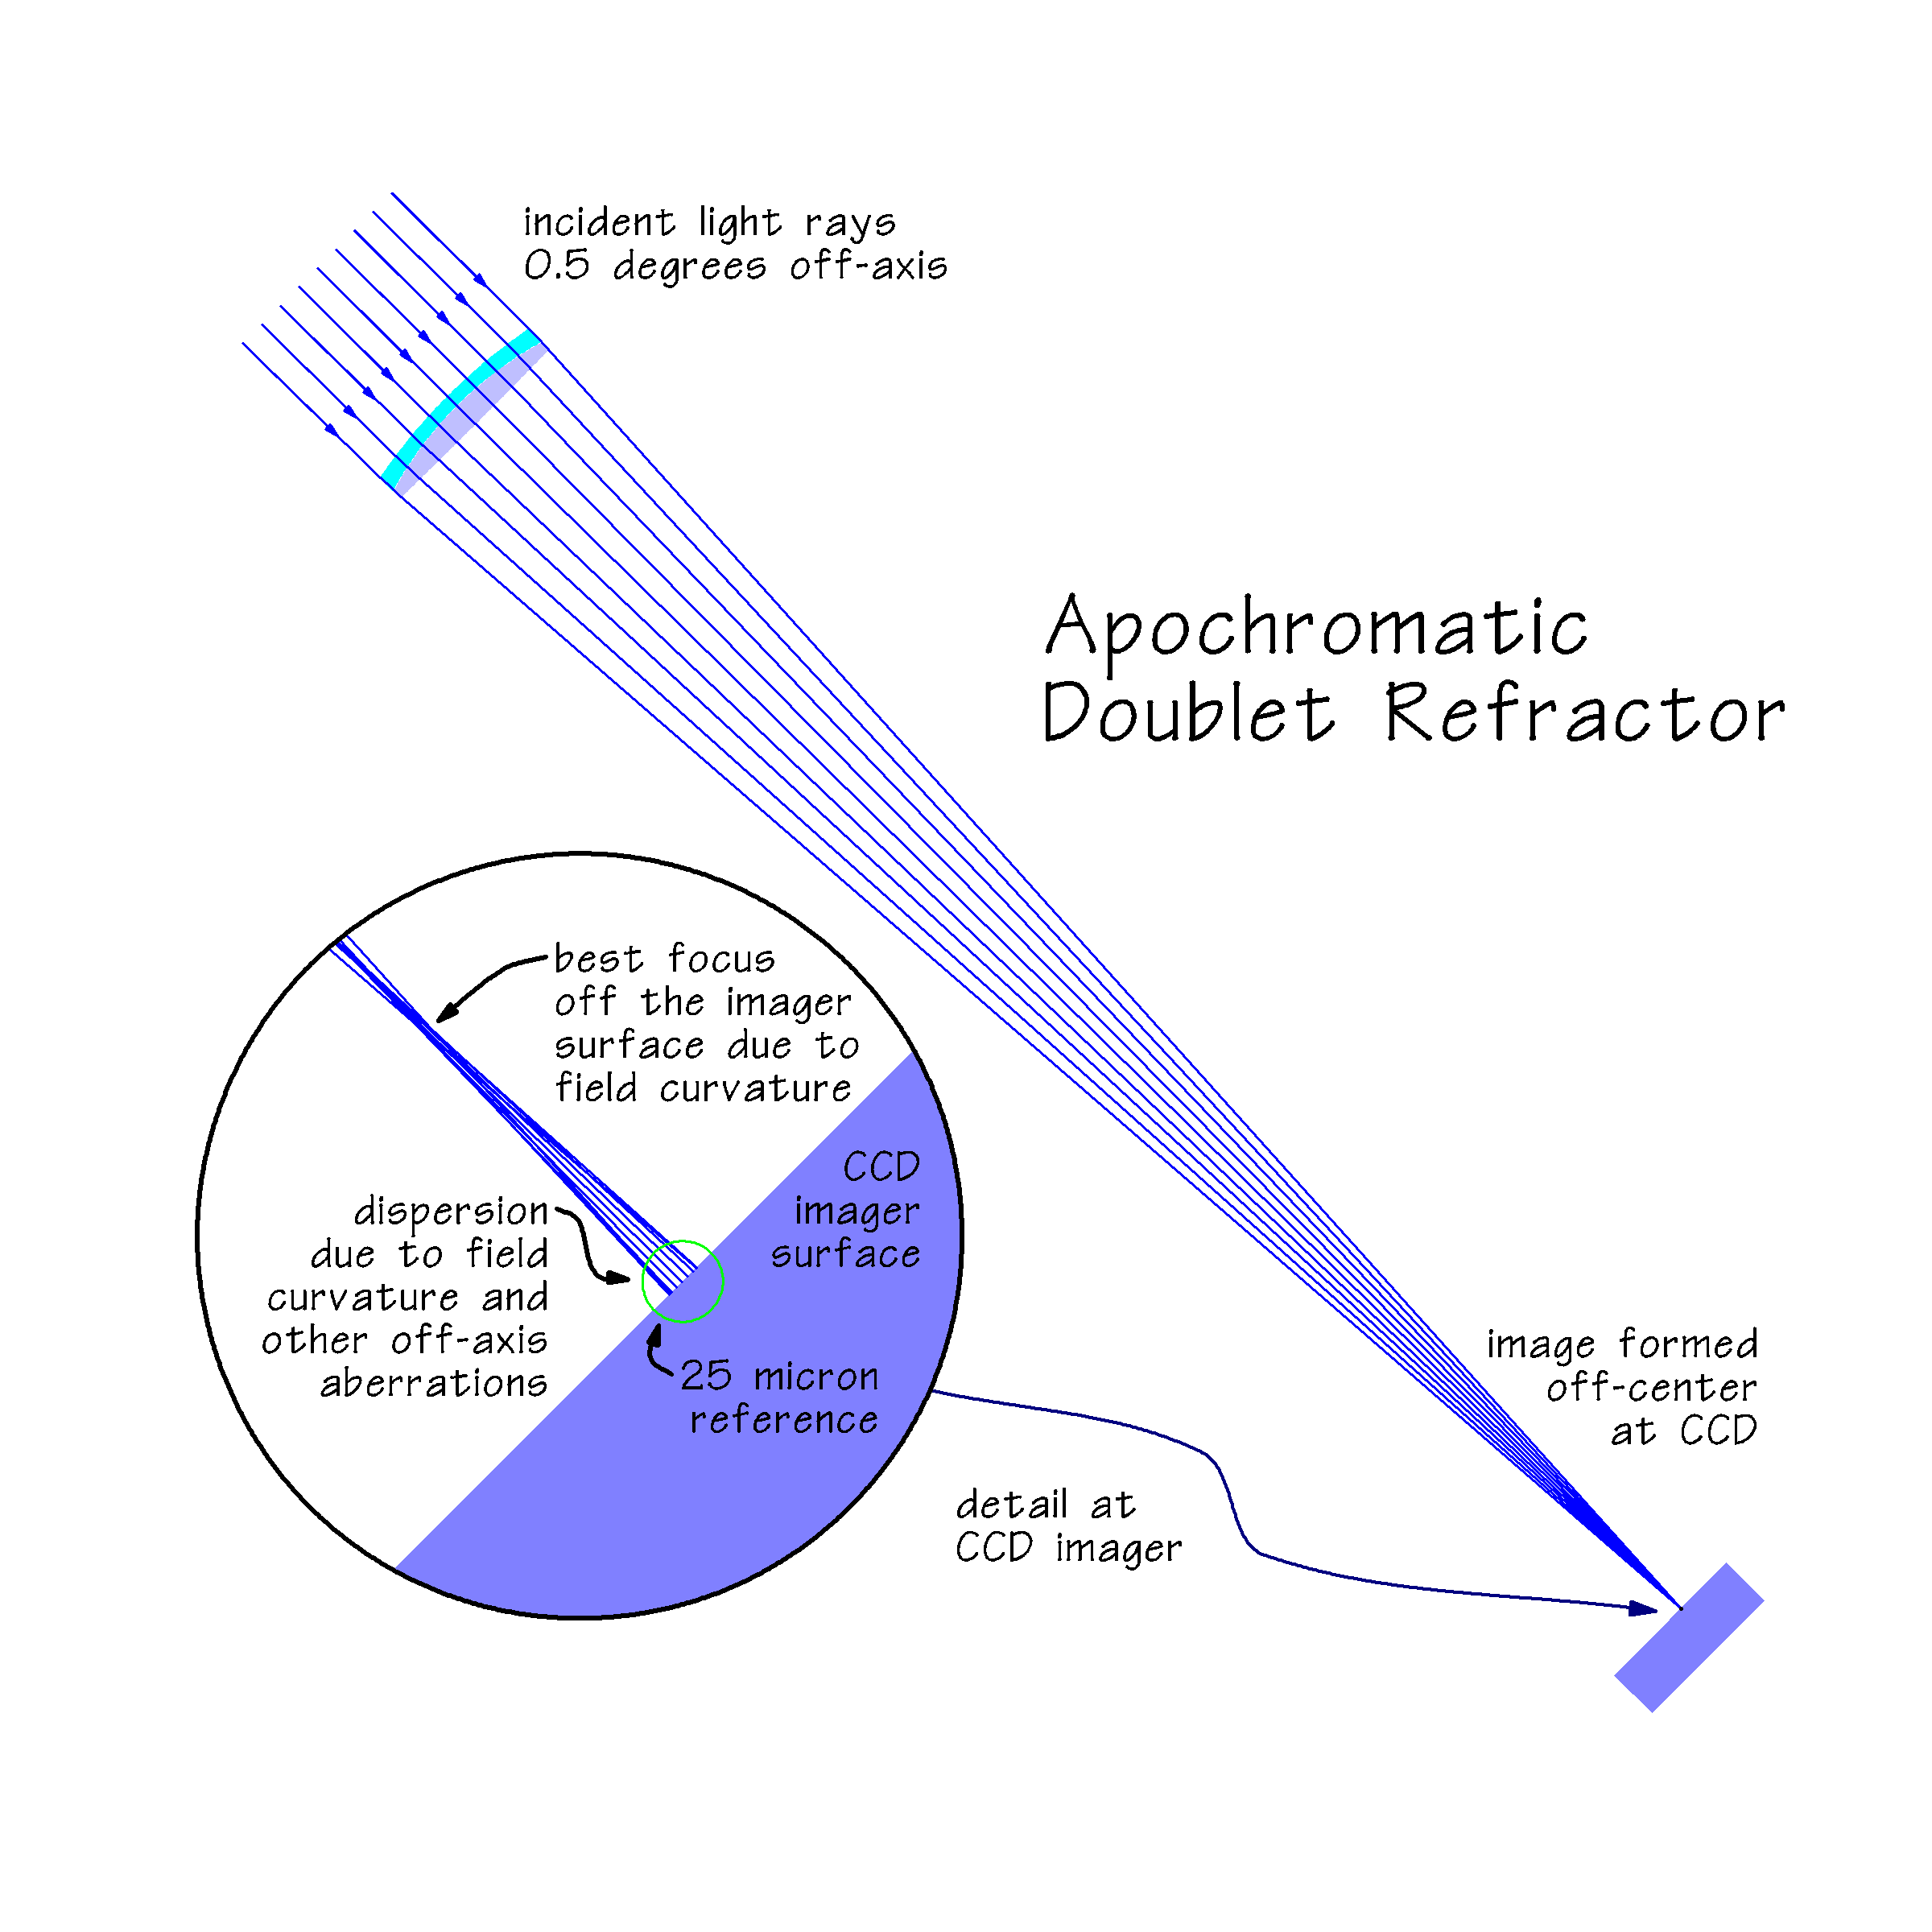
The above example is the same skew ray-trace analysis of the doublet Fluorite apochromatic refractor but now showing the close-up detail of how the image comes to focus on the surface of the CCD imager. The analysis was done with the imaging setup focused at the center of the field of view, which results in less than perfect focus 0.5 degrees off-axis. The less than perfect focus is the result of field curvature, astigmatism, spherical aberrations, and other optical aberrations.
A more detailed and informative analysis would be a spot diagram using a full 3-dimensional analysis instead of the 2-dimensional cross-sectional analysis presented above.
